4 Principles to Create Effective Risk Bow-Tie Diagrams
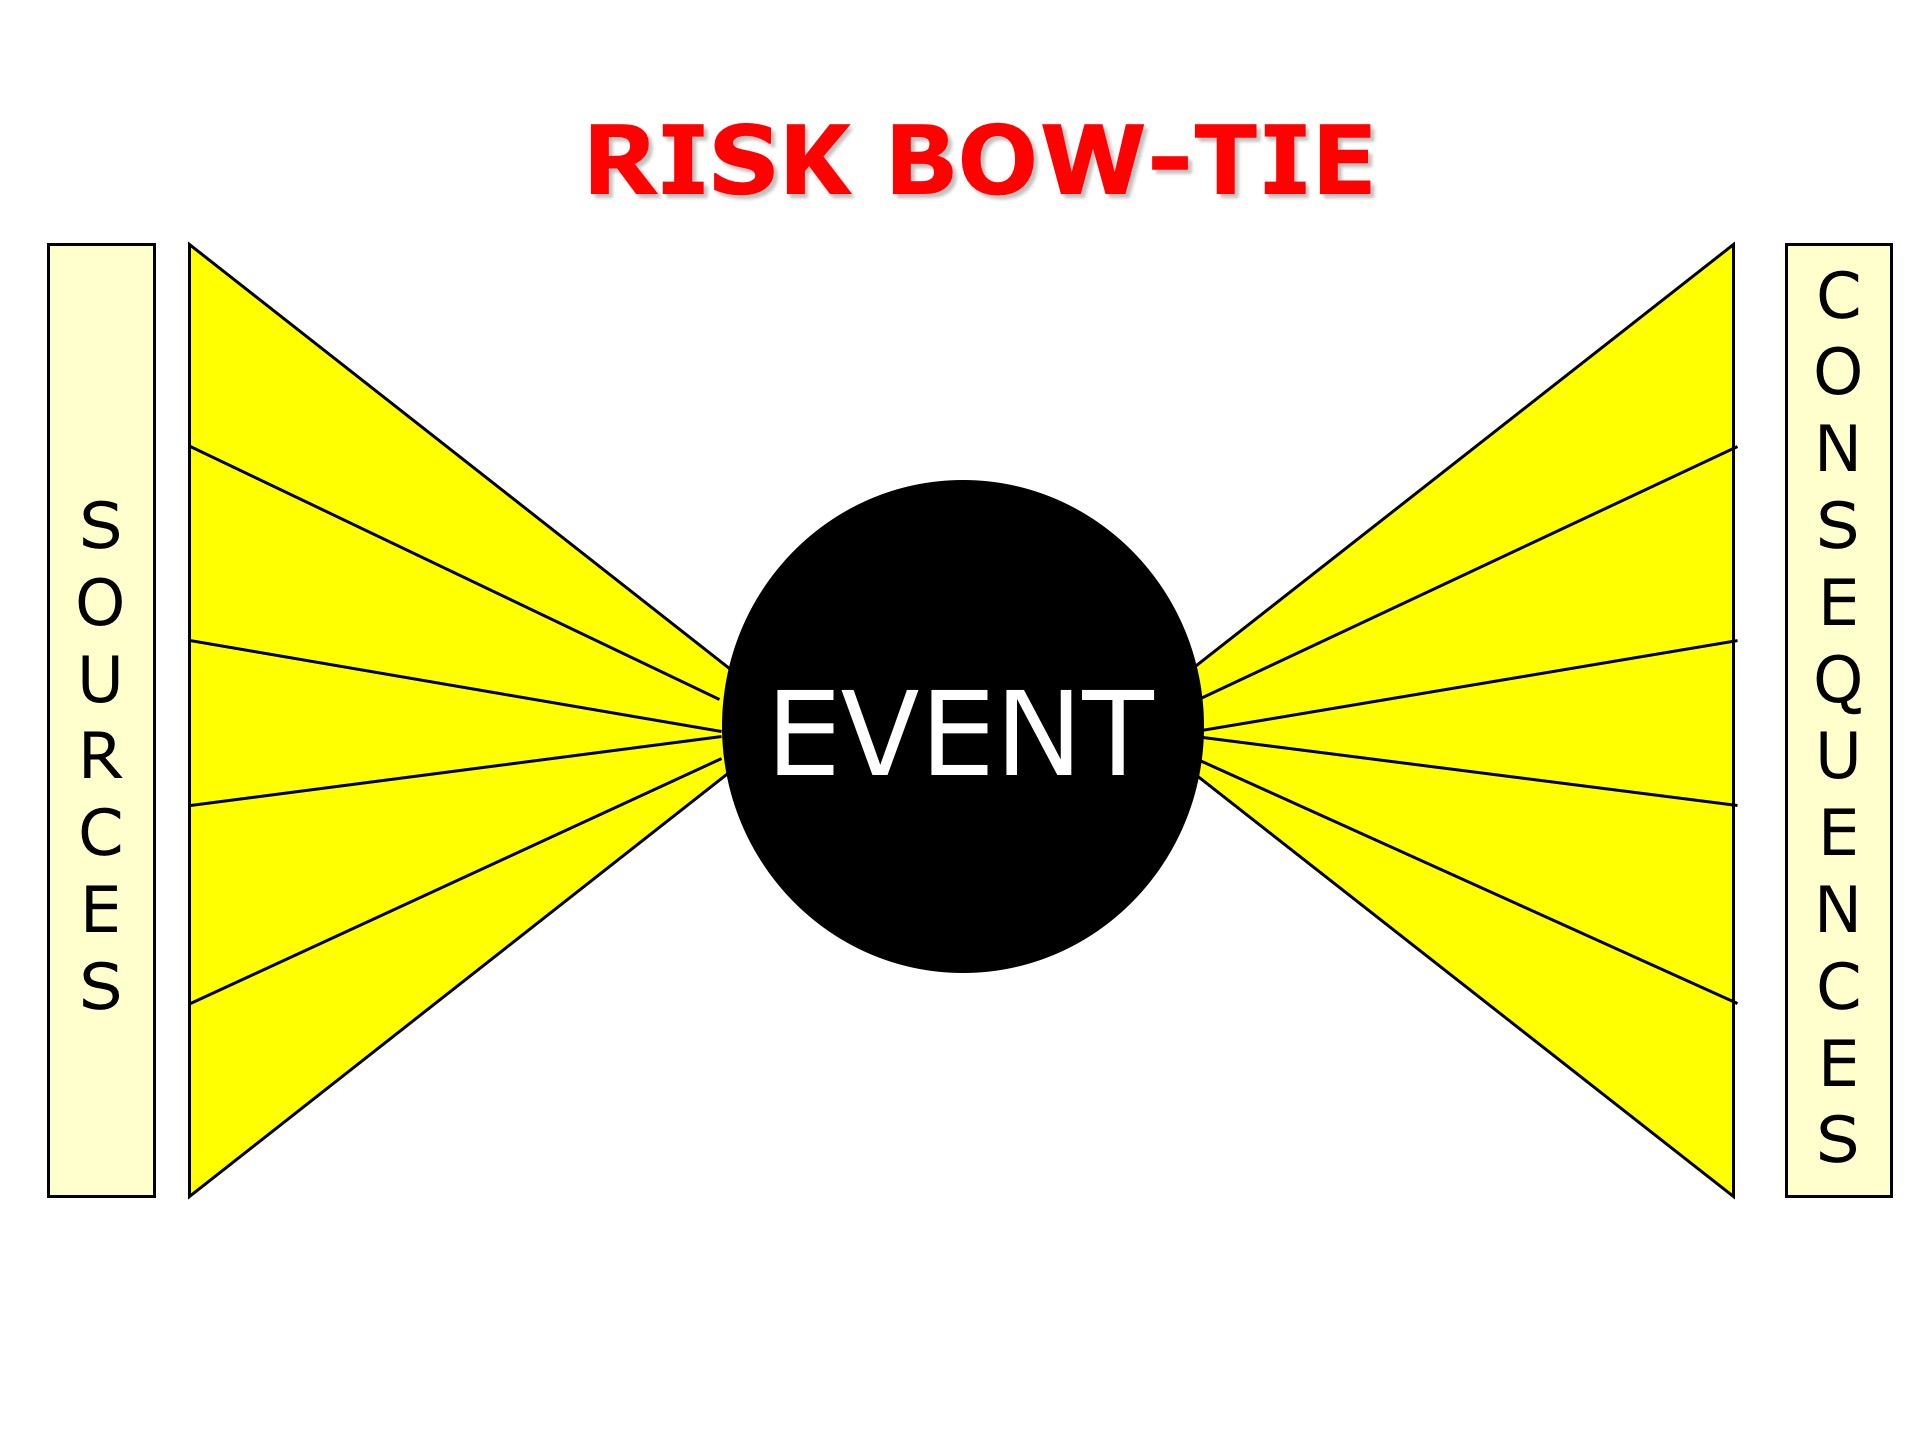 A Risk Bow-Tie Diagram is a visual tool used in Risk Management to analyze and communicate how particular risks can be managed. It gets its name from its shape, which resembles a bow tie. The diagram effectively combines elements of both fault tree analysis and event tree analysis, providing a comprehensive view of risk scenarios.
Here’s a breakdown of the components of a Risk Bow-Tie Diagram:
-
Hazard: At the center of the bow tie is the hazard, which is the source of potential harm.
-
Top Event: Directly linked to the hazard is the top event, representing the moment when control over the hazard is lost, potentially leading to a risk event.
-
Threats: On the left side of the diagram are threats, which are potential causes that can lead to the top event. These are the initiating events or conditions that could trigger the risk.
-
Preventive Controls: Also on the left side, preventive controls are measures or barriers put in place to prevent the threats from causing the top event. These are proactive steps to reduce the likelihood of the risk occurring.
-
Consequences: On the right side of the diagram are consequences, which are the potential outcomes or impacts if the top event occurs.
-
Mitigative Controls: Also on the right side, mitigative controls are measures or barriers designed to minimize the impact or severity of the consequences. These are reactive steps to reduce the impact after the risk has occurred.
The bow-tie diagram provides a clear and concise way to visualize the pathways from threats to consequences, highlighting the controls in place to manage the risk. It is particularly useful for communicating complex risk scenarios to stakeholders, as it simplifies the relationships between causes, events, and effects. Additionally, it helps in identifying gaps in risk management strategies by clearly showing where controls are weak or absent.